
By Kostya Etus, CFA® Chief Investment Officer, Dynamic Investment Management
“The world has just changed so radically, and we’re all running to catch up. I don’t want to jump to any conclusions, but look… Dinosaurs and man, two species separated by 65 million years of evolution have just been suddenly thrown back into the mix together. How can we possibly have the slightest idea what to expect?”
– Dr. Alan Grant (Sam Neill), “Jurassic Park,” 1993
Key Takeaways:
- Is there truth to the generally held idea that stocks perform better in the winter months and underperform during the summer?
- One of the most important questions for both stock and bond market outlooks is where will interest rates be in the future?
- Bonds could potentially be down for three consecutive years. How rare is this and what is the potential opportunity?
We’ve had a unique picture developing in 2023. I’m calling it, The Tale of Three Quarters:
Q1: With the continued downward trend in inflation, investors believed that we were nearing the end of the interest rate hiking cycle from the Federal Reserve (Fed) and we had a welcomed rebound from the depths of 2022 within the stock and bond markets.
Q2: An artificial intelligence boom helped drive a spectacular mega-cap growth technology rally (with the key contributors being coined the “Magnificent Seven”). Unfortunately, banking sector instability and government default fears lead to underperformance in the bond market.
Q3: Good news for the economy spells bad news for the markets in this environment. A robust labor market, persistent inflation and resilient consumer spending all translated into stronger than expected economic growth. This all translates into “higher for longer” interest rate rhetoric from the Fed and leads to decreases in both the stock and bond markets.
The “Stock and Bond Market Returns” chart below tells the tale. Looking forward, we’re going into the seasonally strong Q4 where people forget their troubles and focus on spending time with friends and family for the holidays. More importantly, people are spending lots of money on gifts! Consumer spending strength is often what drives the potential of a year-end stock market rally. Additionally, as we near the eventual end of interest rate hikes, the prospects of a bond market rebound become more attractive.
Stock and Bond Market Returns
Quarterly 2023 Returns as of Sept. 30, 2023
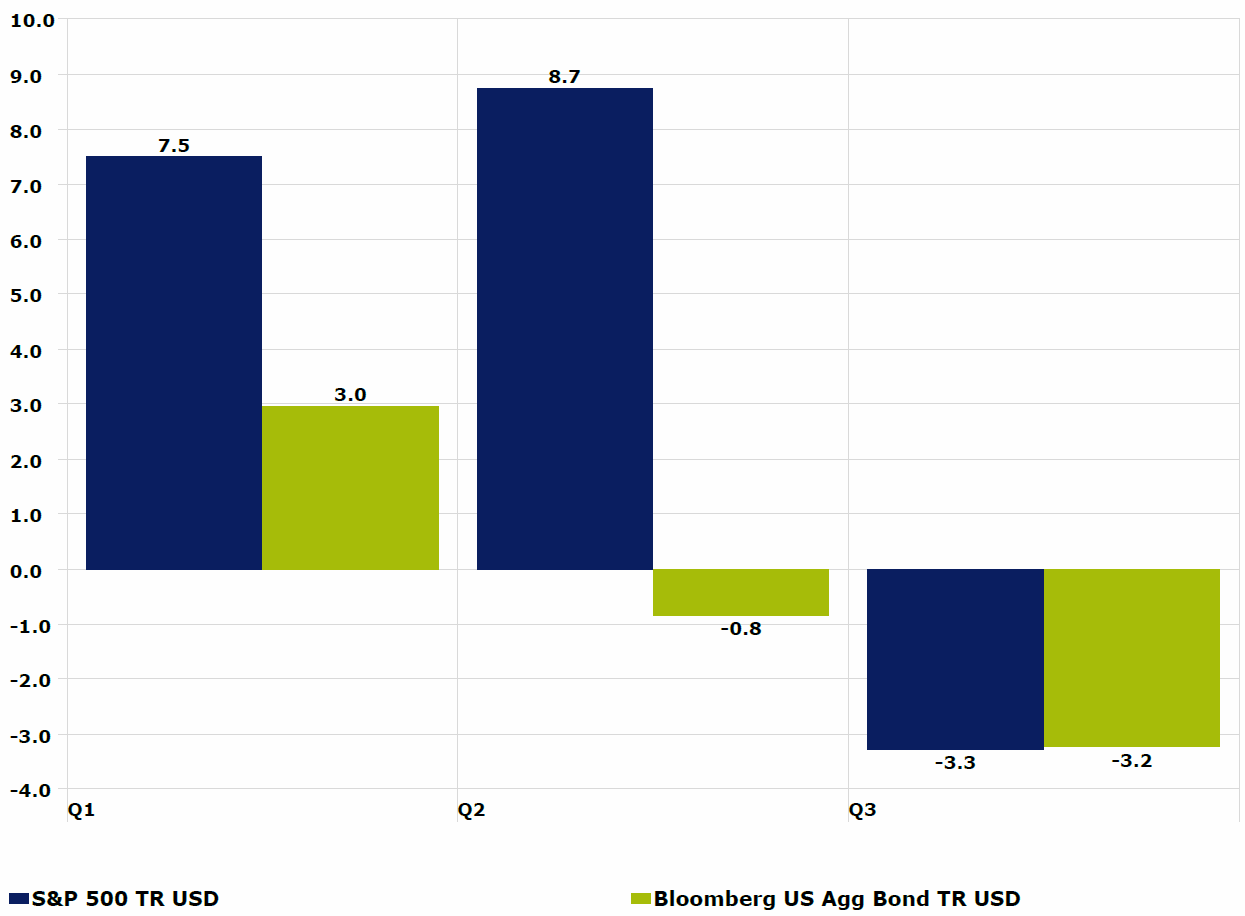
Source: Morningstar Direct as of 9/30/23. Stock Market Returns measured by S&P 500 TR USD, Bond Market Returns measured by Bloomberg US Agg Bond RT USD. Past results are not predictive of results in future periods.
What to Expect in Q4: Welcome, Holiday Season!
There’s an old investment expression that goes, “Sell in May and go away.” This points to a generally held idea that stocks perform better in the winter months and underperform during the summer. This has, of course, never been proven to be true. But looking at monthly averages in the “Stock Market Performance and Probabilities” chart below, here are a few interesting observations:
- The September Effect: September tends to stand out as the lone month with a negative average return and the lowest probability of a positive return. There are some theories around why this may be, one common one being that students are returning to school and thus spending less post summer break.
- Holiday Months: November and December are a couple of the stronger average months and have the highest probabilities of positive returns. Regardless of what the economy or the Fed is doing, we know consumers are spending money on gifts throughout this period, propping up sentiment and overall joy.
- Market vs. Casino: Perhaps the main takeaway from his chart is that 11 of the 12 months are positive on average and the probability of positive returns is generally over 50%. Where else are you going to find odds like that? Definitely not in Vegas!
Stock Market Performance and Probabilities by Month
S&P 500 Returns 1926-2023
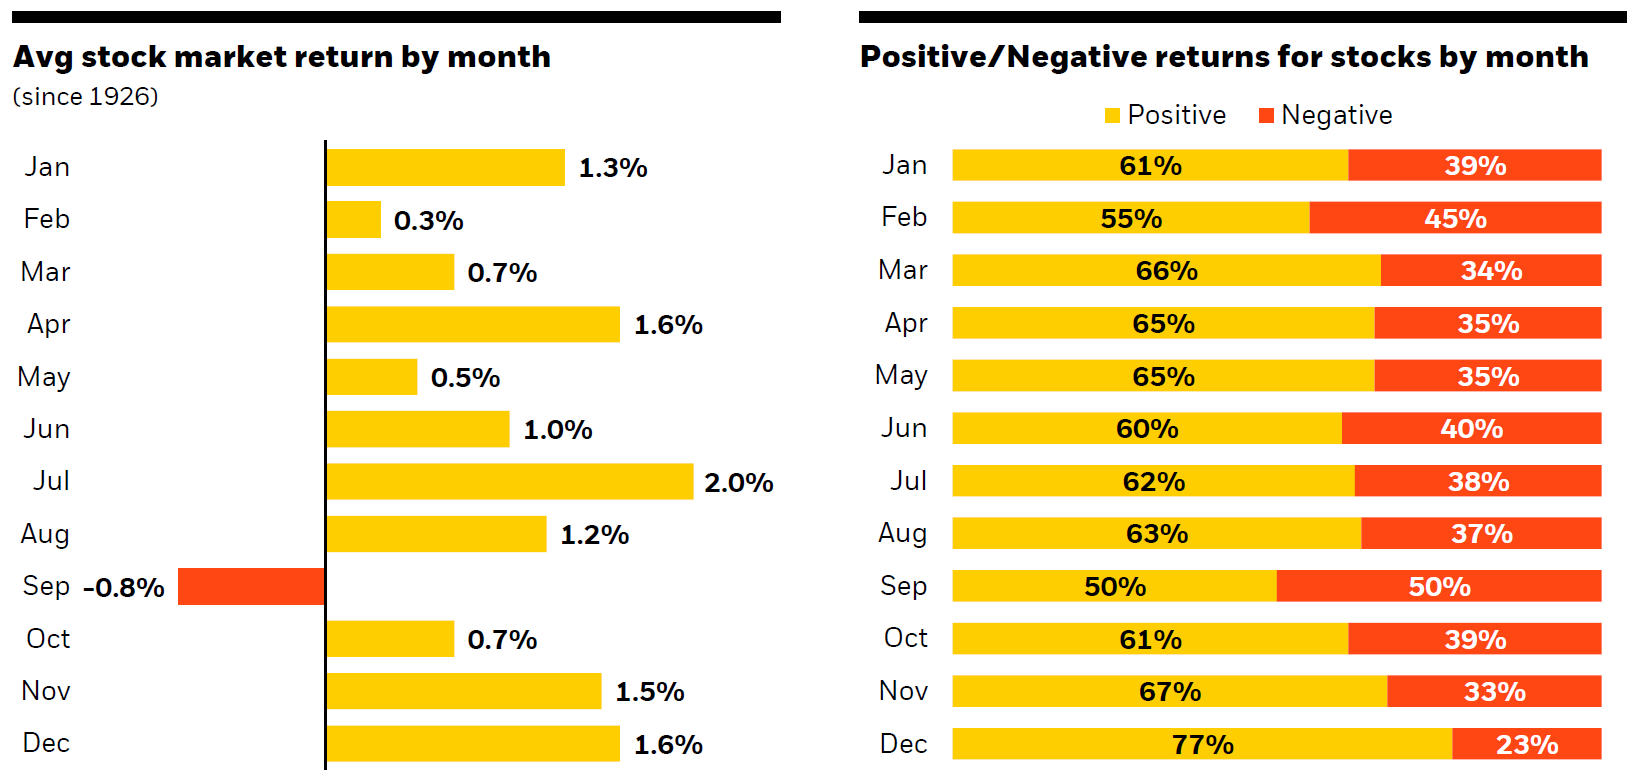
Sources: BlackRock Student of the Market, September 2023. Morningstar as of 8/31/23. U.S. stocks are represented by the S&P 500 Index from 3/4/57 to 8/31/23 and the IA SBBI U.S. Lrg Stock Tr USD Index from 1/1/26 to 3/4/57, unmanaged indexes that are generally considered representative of the U.S. stock market during each given time period. Past performance does not guarantee or indicate future results. Index performance is for illustrative purposes only. You cannot invest directly in the index.
What to Expect in 2024: Lower Rates?
One of the most important factors for both stock and bond market outlooks is the expectations for interest rates in the future.
There are two primary views on future interest rates:
- Federal Open Market Committee (FOMC) Projections: On a quarterly basis, when the Fed meets, each member indicates their view of the midpoint of the range for the federal funds rate at the end of each of the next three years and over the long run. The median of these expectations is viewed as the expected rate. This is commonly referred to as the “Fed Dot Plot.”
- Market Expectations: At any time, a market-implied probability for future fed funds rates can be calculated based on future and forward contracts on overnight financing rates, often referred to as Secured Overnight Financing Rate (SOFR).
The “Fed Funds Implied Rate” chart below is the current comparison between the FOMC projections and market expectations. A few things to notice:
- Any more hikes? Market expectations are indicating the Fed will hold steady for the remainder of 2023.
- When could cuts start? Market expectations are implying rate cuts can begin as early as March.
- Expectations for the New Year? By the end of 2024, rates could be down to a target of about 4.5%. That would equate to potentially three or four quarter percent rate cuts by the Fed in 2024.
A lower interest rate environment in the future could be supportive for economic growth as well as a tailwind for both stock and bond markets.
Fed Funds Implied Rate: FOMC Projections vs. Market Expectations
Grey Dots: Fed Dot Plot Projections
Blue Dots: Fed Median Projections
Blue Line: Market-Implied 3-Month Term SOFR
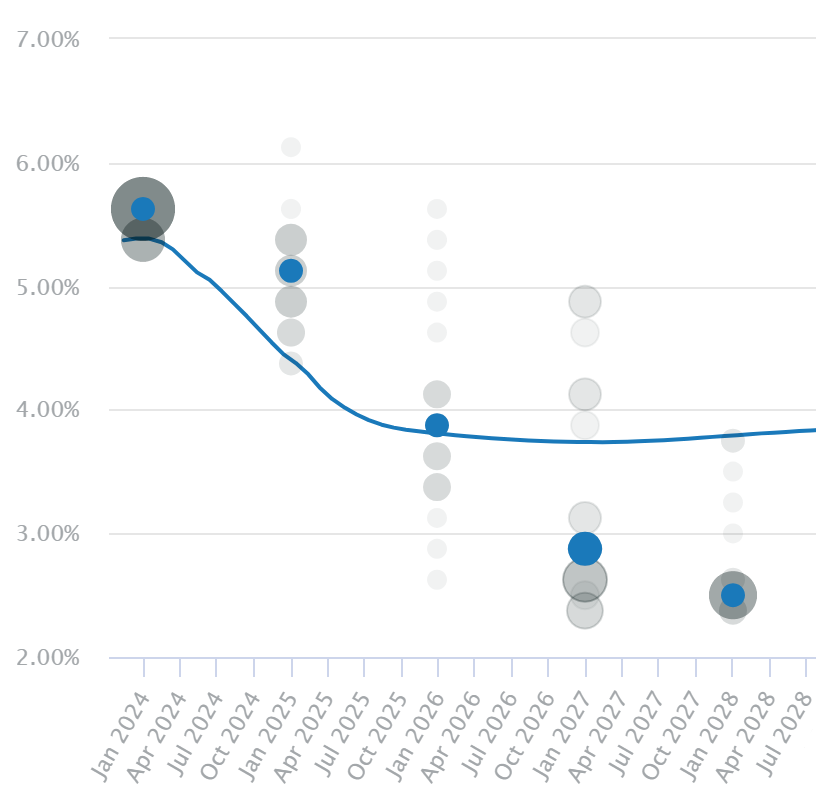
Source: Chatham Financial as of November 8, 2023. https://www.chathamfinancial.com/technology/us-forward-curves
What to Expect at All Times: Stock and Bond Return Probabilities
Continued increases in interest rates in 2023 have brought bond prices down, resulting in negative year-to-date returns for the Bloomberg U.S. Aggregate bond index. This could potentially mark the third consecutive year of negative bond returns.
How rare is this? And what’s the potential opportunity? Let’s evaluate with the “Stock and Bond Return Distribution” chart below:
- Bonds Rarely Lose: Prior to 2021, bonds have only been negative three times in 46 years. And when bonds were down, it was not by much. So, bonds potentially being down in three consecutive years (2021, 2022 and 2023) is truly unique. The beauty of bonds is that they eventually have to return to par value, so the more they fall, the higher the potential for them to spring back up. This sets up for an attractive opportunity for bonds in the current environment.
- Stocks Don’t Lose Too Much Either: It’s refreshing to see that stocks were only down nine of 46 years, that’s an 80%-win rate—you can’t get that at the casino and it’s certainly better than a coin flip. But the main difference between stocks and bonds is the magnitude of some of the down years for stocks is much more significant (one is close to -40%).
- Mixing Stocks and Bonds Is the Best Way to Not Lose: Except for 2022, there hasn’t been a year since 1977 where both stocks and bonds were both down; 2022 was an anomaly. Every other time that stocks were down, bonds were up (often with strong returns). And vice versa, poor bond performance was often met with strong stock performance. Most importantly, most of the dots are in the quadrant with both stocks and bonds outperforming, reminding us that staying diversified and invested for the long-term is the best way to reach investment goals.
Stay diversified, my friends.
Stock and Bond Return Distribution
Percentages from 1977-2022
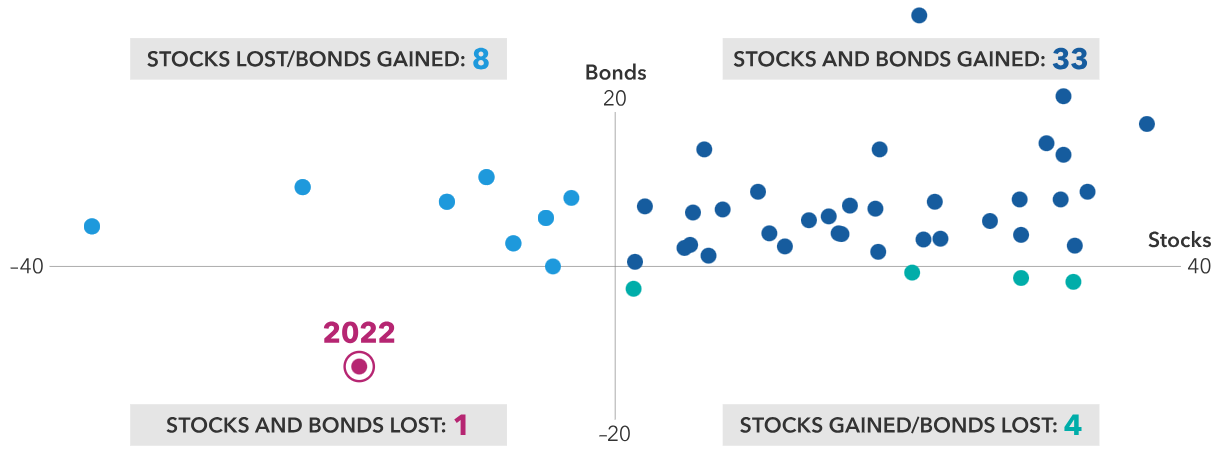
Sources: Capital Group, Bloomberg Index Services Ltd., Standard & Poor’s. Each dot represents an annual stock and bond market return from 1977 through 2022. Stock returns represented by the S&P 500 Index. Bond returns represented by the Bloomberg U.S. Aggregate Index. Past results are not predictive of results in future periods.
As always, Dynamic recommends staying balanced, diversified and invested. Despite short-term market pullbacks, it’s more important than ever to focus on the long-term, improving the chances for investors to reach their goals.
Should you need help navigating client concerns, don’t hesitate to reach out to Dynamic’s Investment Management team at (877) 257-3840, ext. 4 or investmentmanagement@dynamicadvisorsolutions.com.
Disclosures
This commentary is provided for informational and educational purposes only. The information, analysis and opinions expressed herein reflect our judgment and opinions as of the date of writing and are subject to change at any time without notice. This is not intended to be used as a general guide to investing, or as a source of any specific recommendation, and it makes no implied or expressed recommendations concerning the manner in which clients’ accounts should or would be handled, as appropriate strategies depend on the client’s specific objectives.
This commentary is not intended to constitute legal, tax, securities or investment advice or a recommended course of action in any given situation. Investors should not assume that investments in any security, asset class, sector, market, or strategy discussed herein will be profitable and no representations are made that clients will be able to achieve a certain level of performance, or avoid loss.
All investments carry a certain risk and there is no assurance that an investment will provide positive performance over any period of time. Information obtained from third party resources are believed to be reliable but not guaranteed as to its accuracy or reliability. These materials do not purport to contain all the relevant information that investors may wish to consider in making investment decisions and is not intended to be a substitute for exercising independent judgment. Any statements regarding future events constitute only subjective views or beliefs, are not guarantees or projections of performance, should not be relied on, are subject to change due to a variety of factors, including fluctuating market conditions, and involve inherent risks and uncertainties, both general and specific, many of which cannot be predicted or quantified and are beyond our control. Future results could differ materially and no assurance is given that these statements or assumptions are now or will prove to be accurate or complete in any way.
Past performance is not a guarantee or a reliable indicator of future results. Investing in the markets is subject to certain risks including market, interest rate, issuer, credit and inflation risk; investments may be worth more or less than the original cost when redeemed.
Investment advisory services are offered through Dynamic Advisor Solutions, LLC, dba Dynamic Wealth Advisors, an SEC registered investment advisor.