By Kostya Etus, CFA®, Chief Investment Officer, Dynamic Investment Management
“And I know what I have to do now. I gotta keep breathing. Because tomorrow the sun will rise. Who knows what the tide could bring?”
– Chuck Noland (Tom Hanks), “Cast Away,” 2000
As we embark on the great journey that will be 2024, let’s reflect on the key market highlights of 2023—as well as how it compares to 2022 to help put things into perspective. See the table below, “What Worked, What Didn’t in the Markets?”
- Stock Market: It was a great year for the stock market in 2023 as the global market was up close to 23%, more than making up for the losses in 2022. A notable performer was the S&P 500 which finished the year strong with nine consecutive positive weeks, the longest winning streak since 2004. But most importantly, all asset classes delivered double digit returns, including smaller companies and international stocks, highlighting the strength and breath of the rally we exhibited.
- Bond Market: The losing streak is over! After two consecutive years of negative returns in the bond market (2021 and 2022), we saw a positive return in 2023 of more than 5% due primarily to a fourth quarter rebound as interest rates fell based on Federal Reserve (Fed) expectations to lower rates sooner than later in 2024. High yield bonds were the standout performers given a risk-on environment and expectations for a milder recession (if any) in 2024.
- Real Estate: The past few years have been a roller coaster ride for the real estate market. After being a top performer in 2021 (more than 40% return), it was one of the worst performers in 2022. The sector experienced some choppiness in 2023, given continued increases in mortgage rates to levels we haven’t seen since the early 2000s. However, the real estate market was able to squeeze out a positive return close to 12% in 2023, based on expectations for lower rates in the future.
Looking ahead to 2024, we see a lot of the same tailwinds still intact that pushed 2023 ahead. Notably, the Fed is projected to start cutting interest rates in 2024 as inflation continues to come down and fears of a strong recession subside. This will support growth in stocks, boost bond prices and increase real estate demand.
What Worked, What Didn’t in the Markets?
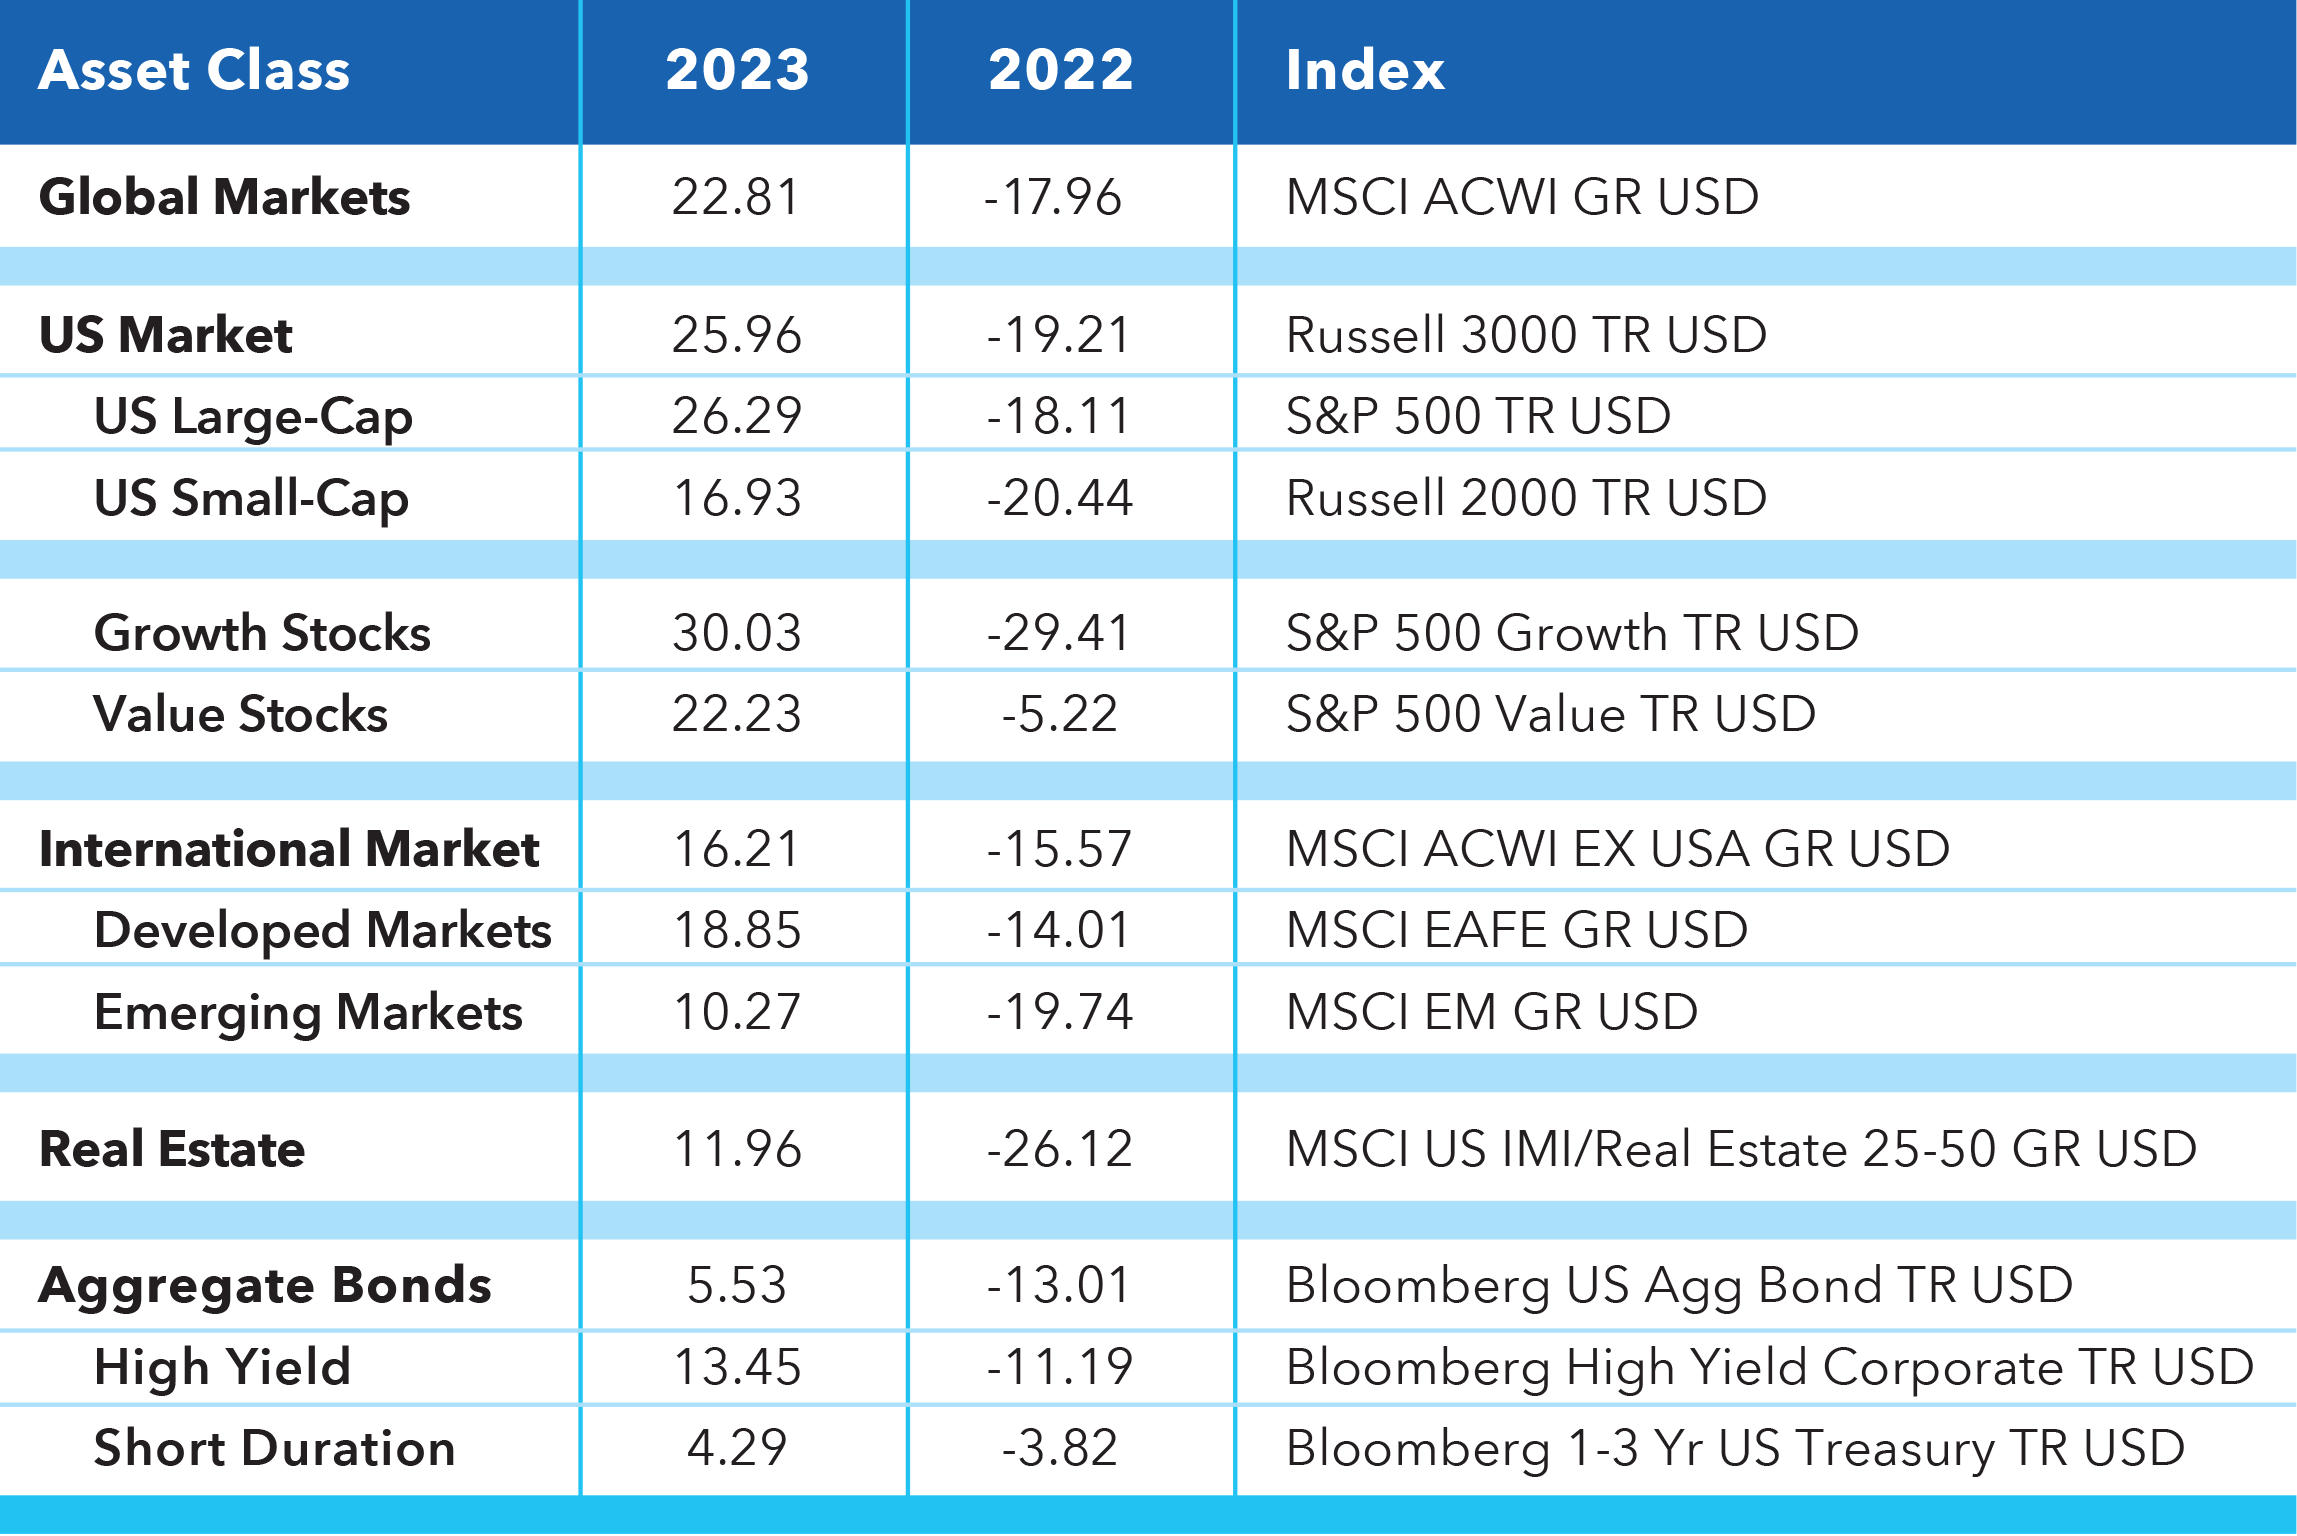
Source: Morningstar Direct as of 12/31/2023. Past performance is not a guarantee of future results.
Key Takeaways:
- Lower rates are on the horizon. What does this mean for the stock and bond markets?
- The market has hit an all-time high. Is it a good time to invest?
- Recession fears are starting to die down. How can the presidential election impact this?
Lower Rates? Not “If” but “When”
Interest rates have reached the highest levels since the early 2000s at more than 5% given the Fed’s aggressive rate hiking policy over the last couple years. This has made cash-like investments (such as money market funds and CDs) quite attractive, particularly given their low-risk profiles.
But what happens to these cash-like investments (and others) as interest rates top out? The graph below, “Investment Opportunities Outside of Cash,” from J.P. Morgan helps shed some light on what to expect based on previous rate hiking cycles:
- Stocks Win: The stock market likes it when rates fall; cash investments don’t. Lower interest rates means it’s easier for companies to borrow money, thus reducing their costs and improving growth. Cash investments simply pay out short-term interest rates as they fall as do investment returns in lockstep.
- Bonds Win: The bond market LOVES it when rates fall. This is simple bond math. As rates go down, bond prices go up. Bonds have faced a couple rough years in the rising rate environment. Now they are spring-loaded to rebound in an environment where rates may be falling. We started to see this play out in late 2023.
- 60/40 Wins: Stocks appear to be No. 1, but not always (given the significant drop in one of the years). Stocks are volatile and less predictable, which is why it’s always prudent to diversify your investments and stay balanced with a mix of stocks and bonds. This approach helps investors navigate a variety of scenarios that the market can unexpectedly throw at them.
Investment Opportunities Outside of Cash
Peak 6-Month CD Rate During Previous Rate Hiking Cycles
and Subsequent 12-Month Total Returns
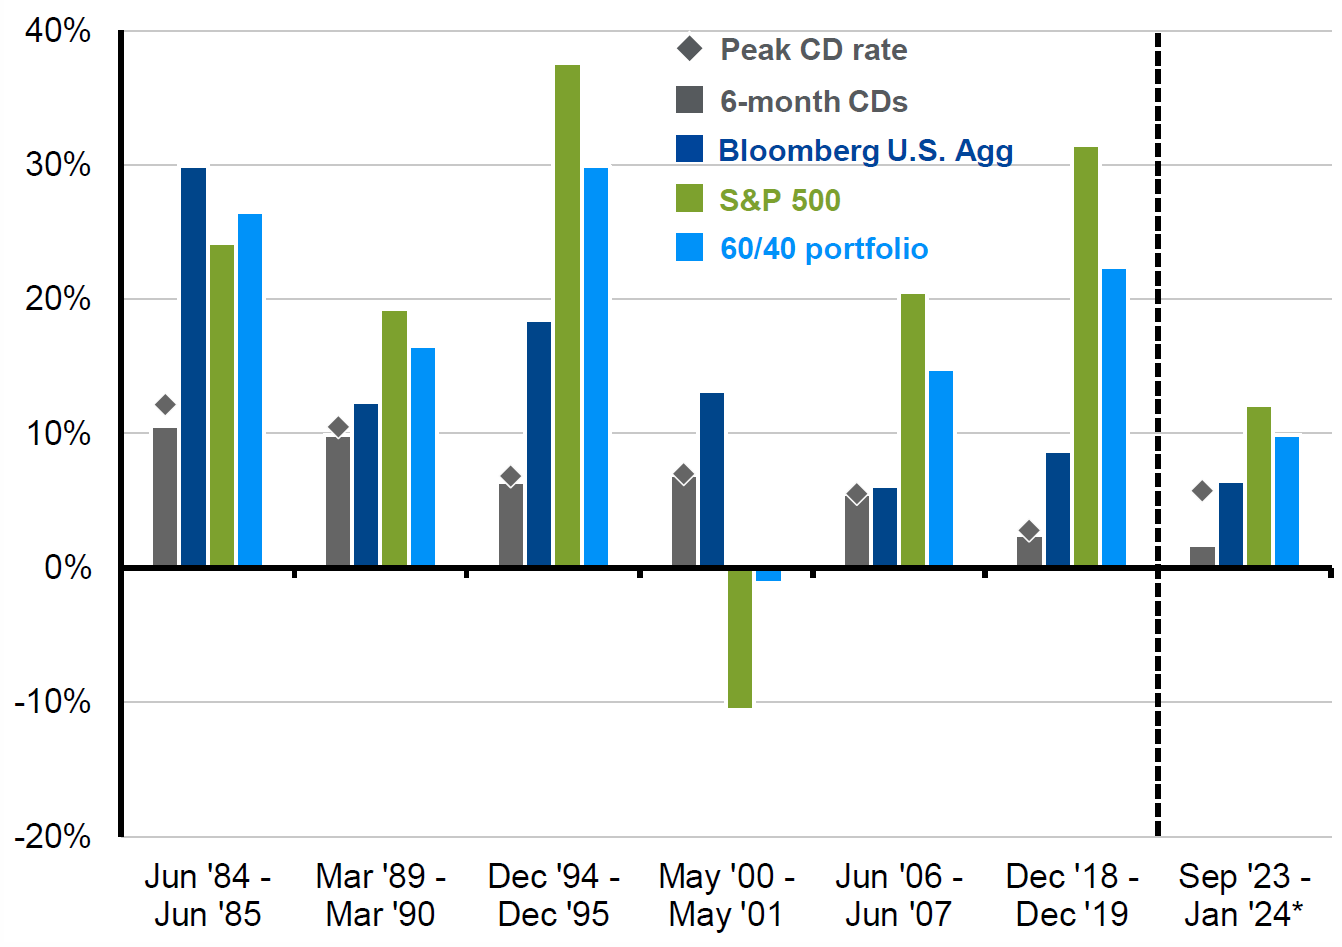
Sources: J.P. Morgan Weekly Market Recap. Bloomberg, Federal Reserve, Robert Shiller, JPMAM. 60/40 portfolio is 60% S&P 500 and 40% Bloomberg U.S. Agg. S&P 500 data prior to 1988 from Robert Shiller. Month-end CD data from the Federal Reserve before 2013 and Bloomberg thereafter. CD return assumes reinvestment at prevailing 6-month rate when initial CD matures. *Return calculated through 1/12/2024. Past performance is not a guarantee of future results.
Investing at Market Highs? It’s Always a Good Time
The S&P 500 isn’t just off to a great start in 2024, it reached a record high in January for the first time in two years (since January of 2022). This means the index is officially in “bull market” territory, i.e., measured from trough to peak when a new record high is set. From the low point (trough) set on Oct. 12, 2022, to the most recent high (peak) on Jan. 30, 2023, the market has been up more than 36%.
Seeing a return of this magnitude and the market continuing to set new highs may give some investors pause, asking themselves, “Is this the right time to be adding money into the stock market? Should I be on the sidelines until there’s a pullback?” We review the chart below, “Investing at All-Time Highs vs. All Dates,” to glean some answers:
- Only Invest at All-Time Highs: Investing at all-time highs has a component of fear and emotion behind it, but it may not be as scary as it seems. Even if you are the unluckiest investor in the world and only manage to invest at the worst possible time over the last 70 years (at all-time highs), you still end up with double digit growth on average. Thus, investing when the market hits peaks is not a losing proposition, however, a long investment horizon is the key to success.
- Investing any Other Time: Timing the market is hard. Waiting for a correction before investing could lead to missing out on significant gains. Perhaps “any time” is a good time to invest in the stock market. As the chart reveals, the average returns are quite strong regardless of when you invest. And most interestingly, it’s only slightly higher than investing at all-time highs.
- Long-Term Investors Win: Over the long-term, the market is more than just a coin flip. This is because over longer time periods the market is based on economic growth and corporate profits. Those two variables tend to go up over time as we innovate and produce more goods and services. Now the market can be choppy over shorter time periods and economic disruptions may happen, however, staying invested for the long-term allows you to cut through the noise and participate in long-term growth.
Investing at All-Time Highs vs. All Dates
S&P 500 Annualized Rolling Returns from Jan. 1, 1950, to Dec. 31, 2020
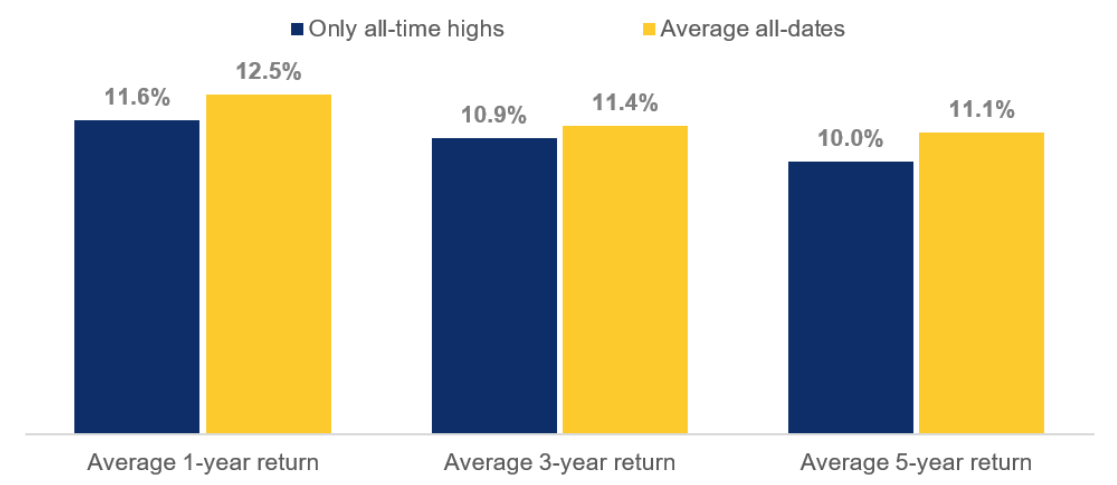
Source: Bloomberg, RBC GAM. Data for S&P 500 as of January 1, 1950 to December 31, 2020. All-dates refers to rolling 1-, 3- and 5-year returns starting from each trading date during this time. Returns in U.S. dollars. An investment cannot be made directly into an index. The graph does not reflect transaction costs, investment management fees or taxes. If such costs and fees were reflected, returns would be lower. Past performance is not a guarantee of future results.
Recession? What Recession?
The resilience of the economy in the face of higher interest rates, as well as moderating inflation, is making investors re-think the concept of a definitive recession, at least a strong one. Additionally, it’s an election year. But what impact does that have?
During the first half of a president’s tenure, there is typically more focus on fulfilling campaign promises, which may not be aimed at strengthening the economy. While in the second half, we re-enter campaign mode with a push to bolster the economy in hopes of seeking re-election. As we get closer, we may see a renewed focus on strengthening the economy from the government, supporting the idea of avoiding a recession in 2024.
Lastly, there’s a lot of focus placed on which party may be better for the economy or the markets. As a result, another question emerges: Does it matter which party holds the presidency as it relates to growth? The below chart, “Long-Term U.S. Stock Returns and Elections,” helps with the answer:
- Democrats Win – Market Goes Up: Election results can have an impact on government policy, laws and foreign relations, but they have less impact on the direction and strength of the market. As investors, it may be more important to focus on the things we can control such as staying invested for the long-term.
- Republicans Win – Market Goes Up: As a reminder, while presidential elections often control the news headlines, they don’t control the financial markets. Market returns are often more dependent of the economy and inflation, which are little impacted by elections.
- Long-Term Investors Win: It turns out the time invested in the market is really the most important factor to growth, not which political party holds the presidency. As the chart shows, if you weren’t invested over the yellow shaded time periods or the orange ones, you would miss out on significant gains.
Stay diversified, my friends.
Long-Term U.S. Stock Returns and Elections
Growth of $1k since 1926, cumulative returns from Jan. 1, 1926 to Dec. 31, 2023
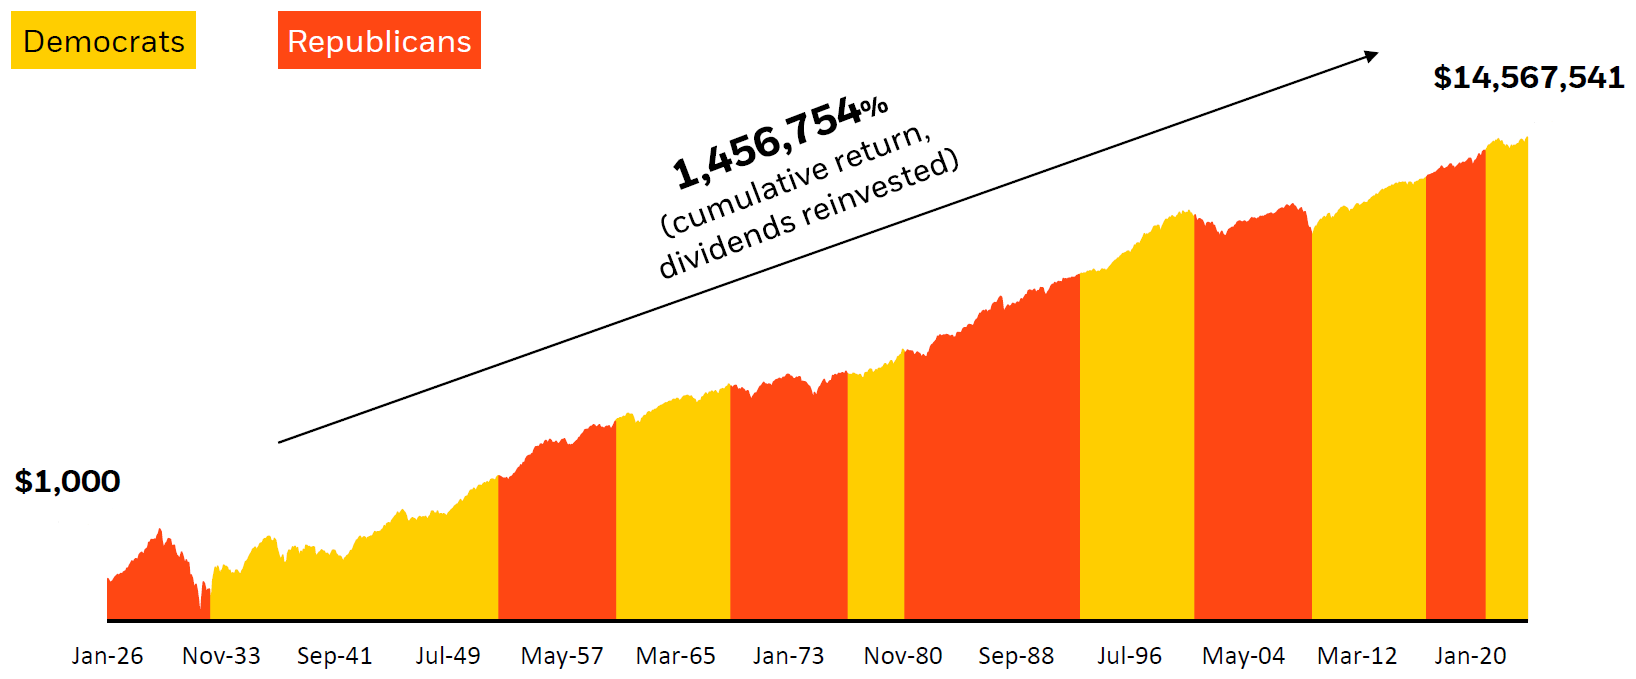
Source: Blackrock. Morningstar as of 12/31/23. Stock market represented by the S&P 500 Index from 1/1/1970 to 9/30/2023 and IA SBBI U.S. large cap stocks index from 1/1/1926 to 1/1/1970. Past performance does not guarantee or indicate future results. Index performance is for illustrative purposes only. You cannot invest directly in the index.
As always, Dynamic recommends staying balanced, diversified and invested. Despite short-term market pullbacks, it’s more important than ever to focus on the long-term, improving the chances for investors to reach their goals.
Should you need help navigating client concerns, don’t hesitate to reach out to Dynamic’s Investment Management team at (877) 257-3840, ext. 4 or investmentmanagement@dynamicadvisorsolutions.com.
Disclosures
This commentary is provided for informational and educational purposes only. The information, analysis and opinions expressed herein reflect our judgment and opinions as of the date of writing and are subject to change at any time without notice. This is not intended to be used as a general guide to investing, or as a source of any specific recommendation, and it makes no implied or expressed recommendations concerning the manner in which clients’ accounts should or would be handled, as appropriate strategies depend on the client’s specific objectives.
This commentary is not intended to constitute legal, tax, securities or investment advice or a recommended course of action in any given situation. Investors should not assume that investments in any security, asset class, sector, market, or strategy discussed herein will be profitable and no representations are made that clients will be able to achieve a certain level of performance, or avoid loss.
All investments carry a certain risk and there is no assurance that an investment will provide positive performance over any period of time. Information obtained from third party resources are believed to be reliable but not guaranteed as to its accuracy or reliability. These materials do not purport to contain all the relevant information that investors may wish to consider in making investment decisions and is not intended to be a substitute for exercising independent judgment. Any statements regarding future events constitute only subjective views or beliefs, are not guarantees or projections of performance, should not be relied on, are subject to change due to a variety of factors, including fluctuating market conditions, and involve inherent risks and uncertainties, both general and specific, many of which cannot be predicted or quantified and are beyond our control. Future results could differ materially and no assurance is given that these statements or assumptions are now or will prove to be accurate or complete in any way.
Past performance is not a guarantee or a reliable indicator of future results. Investing in the markets is subject to certain risks including market, interest rate, issuer, credit and inflation risk; investments may be worth more or less than the original cost when redeemed.
Investment advisory services are offered through Dynamic Advisor Solutions, LLC, dba Dynamic Wealth Advisors, an SEC registered investment advisor.